Enjoy complimentary access to top ideas and insights — selected by our editors.
High
Read more:
The top five metros had an average change in value of new residential housing units of 81.98% between those two periods.
Read more about the metro areas where
| Rank | Metro | Percentage change in value of new residential housing units | Total change in value of new residential housing units | Percentage change in new residential housing units | Total change in new residential housing units |
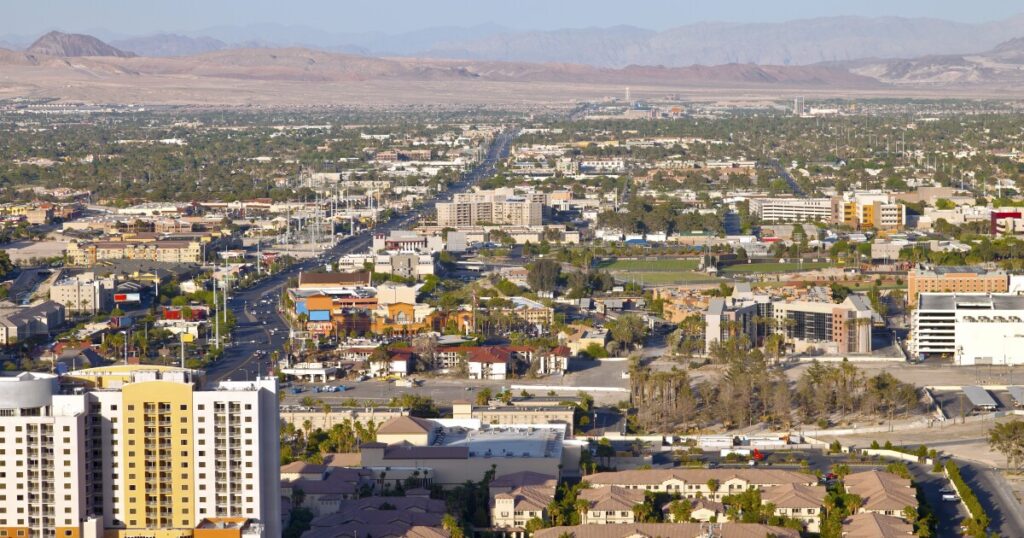
| 1 | Las Vegas-Henderson-North Las Vegas, NV | 106.9 | $443,476,263 | 69.60% | 1,417 |
| 2 | San Diego-Chula Vista Carlsbad, CA | 80.90% | $303,380,625 | 115.90% | 1,759 |
| 3 | Indianapolis-Carmel-Greenwood, IN | 80.00% | $450,008,467 | 51.10% | 1,255 |
| 4 | Denver-Aurora-Centennial, Co | 75.80% | $663,535,194 | 70.10% | 2,690 |
| 5 | Memphis, TN-MS-AR | 66.30% | $86,637,612 | 90.70% | 450 |
| 6 | Tucson, AZ | 49.50% | $136,757,676 | 25.80% | 281 |
| 7 | Nashville-Davidson– Murfreesboro–Franklin, TN | 44.40% | $373,111,832 | 54.10% | 1,595 |
| 8 | Birmingham, AL | 42.50% | $78,418,073 | 51.60% | 303 |
| 9 | Riverside-San Bernardino -Ontario, CA | 37.70% | $249,354,201 | 3.60% | 124 |
| 10 | Sacramento-Roseville-Folsom, CA | 37.50% | $188,362,960 | 21.80% | 417 |
| 11 | Phoenix-Mesa-Chandler, AZ | 36.20% | $694,316,357 | 27.10% | 2,559 |
| 12 | Pittsburgh, PA | 34.70% | $74,262,685 | 36.70% | 299 |
| 13 | Richmond, VA | 33.60% | $118,472,463 | 27.80% | 661 |
| 14 | Tulsa, OK | 33.40% | $64,809,937 | 22.70% | 186 |
| 15 | Milwaukee-Waukesha, WI | 31.40% | $63,263,976 | 52.50% | 307 |
| 16 | Virginia Beach-Chesapeake-Norfolk, VA- NC | 30.80% | $75,475,371 | 48.40% | 484 |
| 17 | Raleigh-Cary, NC | 30.40% | $278,735,249 | 26.50% | 1,236 |
| 18 | Kansas City, MO-KS | 28.30% | $126,294,473 | 20.40% | 360 |
| 19 | Tampa-St. Petersburg Clearwater, FL | 26.80% | $375,625,230 | -11.40% | -874 |
| 20 | San Jose-Sunnyvale-Santa Clara, CA | 26.20% | $59,484,406 | 83.00% | 526 |


